Posts

Financial Freedom Starts Here: Why You Should Save 10% of Your Income

Image
By:  Ivan Cavric Hey there, savvy savers! Today, we're diving into one of the most powerful financial habits you can adopt—saving 10% of your income for the future. Buckle up and get ready to supercharge your savings game! Why 10%? You might be wondering, why 10%? Well, let me tell you—it's the sweet spot. It's enough to make a meaningful impact on your future financial security without feeling like you're sacrificing your current lifestyle. Plus, it's a simple, easy-to-remember rule that anyone can follow. The Importance of Saving for the Future Let's face it—we live in uncertain times. Whether it's unexpected expenses, job loss, or economic downturns, having a financial safety net is crucial. By saving 10% of your income, you're building that safety net—one paycheck at a time. It's your ticket to peace of mind and financial freedom down the road. How to Implement the 10% Rule Now, you might be thinking, "Sure, saving 10% sounds great in the...

Mastering Risk Management with Stop Losses

Image
By: Ivan Cavric Hey there, fellow traders and investors! Today, let's talk about stop losses—a nifty little tool that can save your behind in the wild world of trading. Now, if you're not familiar with stop losses, buckle up and get ready for a crash course in risk management. So, what exactly is a stop loss? Well, it's like a safety net for your trades. You place an order with your broker to buy or sell a stock once it hits a certain price. This helps you protect your hard-earned cash by automatically bailing out when the market starts to go south. Now, why is this important? Picture this: you're riding high on a trade, feeling like the Wolf of Wall Street, and then bam! The market takes a nosedive, and suddenly you're watching your profits evaporate faster than you can say "sell, sell, sell!" That's where a stop loss comes in handy. See, by setting a stop loss at a predetermined level, you're drawing a line in the sand. It's like saying, ...

Understanding Technical Indicators: A Comprehensive Guide for Traders

Image
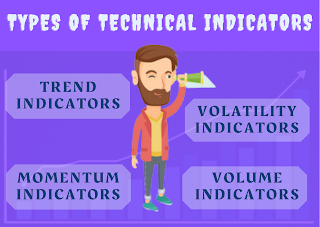
By:  Ivan Cavric  Technical indicators are tools used by traders to analyze financial markets and predict future price movements. They are popular among traders because they help to identify potential trading opportunities and can assist in making more informed trading decisions. In this article, we will explore what technical indicators are, when they are used, and why they are popular for trading. What are technical indicators? Technical indicators are mathematical calculations based on the price and volume of an asset over time. They are used to analyze price movements and identify trends in the market. Technical indicators can be applied to any financial market, including stocks, bonds, commodities, and currencies. There are two types of technical indicators: leading indicators and lagging indicators. Leading indicators are used to predict future price movements and are therefore considered more valuable. Lagging indicators are used to confirm trends that have already occu...

Schaff Trend Cycle: A Powerful Momentum Indicator for Identifying Trends

Image
By:  Ivan Cavric   Schaff Trend Cycle is a momentum indicator that is designed to identify trends in the market. It was developed by Doug Schaff and is based on the principle of combining two popular indicators - the Moving Average Convergence Divergence (MACD) and the stochastic oscillator. The Schaff Trend Cycle indicator is calculated using the following steps: Calculate the MACD by subtracting the 26-period exponential moving average (EMA) from the 12-period EMA. Calculate the signal line by taking a 9-period EMA of the MACD. Calculate the slow stochastic oscillator using the high, low, and closing prices over a specified period. Calculate the Schaff Trend Cycle by applying a 10-period EMA to the slow stochastic oscillator. The resulting indicator is a smoothed version of the slow stochastic oscillator that combines the power of the MACD and stochastic oscillator to identify trends in the market. One of the main advantages of the Schaff Trend Cycle indicator is its ability...

Keltner Channels: A Unique Approach to Identifying Overbought and Oversold Conditions

Image
By:  Ivan Cavric   Keltner Channels is a popular technical indicator that can be used to identify overbought and oversold conditions in the market. It was developed by Chester W. Keltner in the 1960s and is based on the principle of using a moving average and a range-based calculation to create upper and lower bands around price action. The Keltner Channel consists of three lines: The middle line, which is a moving average of the price action. The upper line, which is calculated by adding the average true range (ATR) of the instrument to the middle line. The lower line, which is calculated by subtracting the ATR from the middle line. The ATR is a measure of volatility and is calculated by taking the average of the true range over a specified period. The true range is the greatest of the following: The difference between the current high and the previous close. The difference between the current low and the previous close. The difference between the current high and the current...

Renko Chart Indicator: A Different Perspective on Price Movement

Image
By:  Ivan Cavric   Renko chart is a popular trading tool used by traders to visualize the price movement of an asset in a unique way. The Renko chart indicator is not a traditional chart that displays the price movement over time. Instead, it uses bricks to represent price movement. In this article, we will explain what a Renko chart is and provide an example of how to use it. What is a Renko Chart? A Renko chart is a type of chart that is used to display price movements of an asset. It is unique in that it does not use time as the x-axis, but instead, it uses price movement to create blocks, or bricks, that are then stacked on top of each other. Each brick represents a set price movement, and the chart only displays new bricks when a certain price threshold is met. The Renko chart is designed to filter out minor price movements and help traders identify significant price trends. It is particularly useful in trending markets, where traditional charts can be misleading due...

Unlocking Trading Success: The Truth About Technical Indicators

Image
by: Ivan Cavric Technical trading indicators are a popular tool for traders in the financial markets. These indicators are mathematical calculations based on price and/or volume data that are used to identify trends, patterns, and potential trading opportunities. With so many indicators available, traders often wonder if there is a best technical trading indicator and how to use it successfully. The answer to whether there is a best technical trading indicator is no. Different indicators work well for different traders and market conditions. It's important to understand that no indicator is perfect and they all have their limitations. The key to using technical indicators successfully is to understand their strengths and weaknesses, and to use them in conjunction with other tools and analysis techniques. One popular technical trading indicator is the moving average. This indicator calculates the average price of an asset over a specified time period and plots it on a chart. Trader...