Understanding and Using the Heiken Ashi Indicator in Technical Analysis
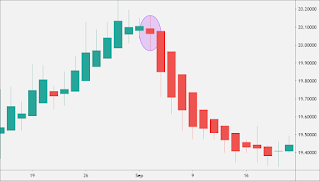
by: Ivan Cavric The Heiken Ashi indicator is a popular tool used in technical analysis to smooth out price data and filter out market noise. Developed by Japanese analyst Goichi Hosoda, the Heiken Ashi indicator can help traders identify trends and make better informed trading decisions. Unlike traditional candlestick charts, which plot the open, high, low, and close (OHLC) prices for a given time period, the Heiken Ashi indicator plots the average price of a security over a given time period. This is done by taking the average of the open, high, low, and close prices and then plotting the resulting value as a new candle on the chart. To calculate the Heiken Ashi candle, the following formulas are used: Heiken Ashi Close (HA-Close) = (Open + High + Low + Close)/4 Heiken Ashi Open (HA-Open) = (HA-Open (previous candle) + HA-Close (previous candle))/2 Heiken Ashi High (HA-High) = max(High, HA-Open, HA-Close) Heiken Ashi Low (HA-Low) = min(Low, HA-Open, HA-Close) One of the main benefits...
