Understanding and Using the Heiken Ashi Indicator in Technical Analysis
The Heiken Ashi indicator is a popular tool used in technical analysis to smooth out price data and filter out market noise. Developed by Japanese analyst Goichi Hosoda, the Heiken Ashi indicator can help traders identify trends and make better informed trading decisions.
Unlike traditional candlestick charts, which plot the open, high, low, and close (OHLC) prices for a given time period, the Heiken Ashi indicator plots the average price of a security over a given time period. This is done by taking the average of the open, high, low, and close prices and then plotting the resulting value as a new candle on the chart.
To calculate the Heiken Ashi candle, the following formulas are used:
- Heiken Ashi Close (HA-Close) = (Open + High + Low + Close)/4
- Heiken Ashi Open (HA-Open) = (HA-Open (previous candle) + HA-Close (previous candle))/2
- Heiken Ashi High (HA-High) = max(High, HA-Open, HA-Close)
- Heiken Ashi Low (HA-Low) = min(Low, HA-Open, HA-Close)
One of the main benefits of using the Heiken Ashi indicator is that it can help traders identify trends more easily. Traditional candlestick charts can be volatile and may include a lot of noise, making it difficult to discern the underlying trend. By smoothing out the price data and plotting the average price, the Heiken Ashi indicator makes it easier to identify trends and make more informed trading decisions.
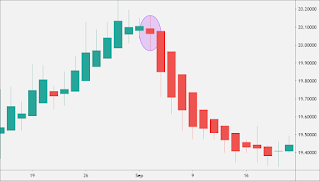
In addition to helping traders identify trends, the Heiken Ashi indicator can also be used to identify potential reversal points. When the Heiken Ashi candle changes color, it can indicate a potential reversal in the trend. For example, if the Heiken Ashi candle is green (indicating an uptrend), and it suddenly turns red (indicating a downtrend), it may be a sign that the trend is reversing.
To use the Heiken Ashi indicator, traders can add it to their charts in their trading platform. Most platforms will offer the Heiken Ashi indicator as a default option, but if it is not available, traders can also add it as a custom indicator. Once the indicator is added to the chart, traders can customize the settings to their liking, such as changing the time period or the color of the candles.
It is important to note that the Heiken Ashi indicator should not be used in isolation. As with any technical indicator, it is best to use it in conjunction with other tools and analysis techniques to get a more complete picture of the market. Some traders may also find it helpful to use the Heiken Ashi indicator in combination with traditional candlestick charts to get a better understanding of price action.
In conclusion, the Heiken Ashi indicator is a useful tool for traders looking to smooth out price data and identify trends. By plotting the average price of a security over a given time period, the Heiken Ashi indicator can help traders make more informed trading decisions and identify potential reversal points. However, it is important to use the Heiken Ashi indicator in conjunction with other tools and analysis techniques to get a more complete picture of the market.


Comments
Post a Comment