Discover the Power of Bollinger Bands: The Ultimate Guide to Trading with this Indicator
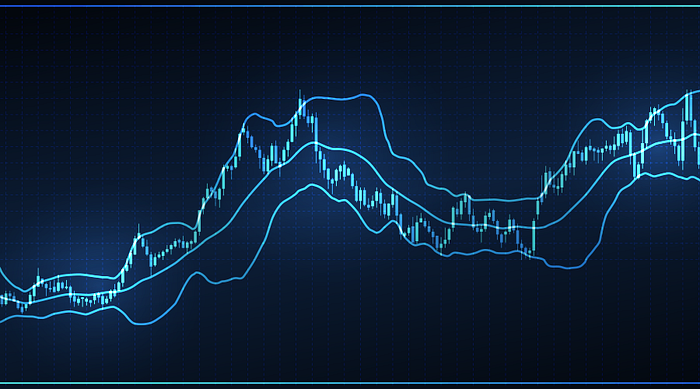
Bollinger Bands are a technical analysis tool invented by John Bollinger in the 1980s. They consist of a simple moving average and two upper and lower bands that are placed above and below the moving average. The bands are typically set two standard deviations above and below the moving average, although the distance can be modified.
The purpose of Bollinger Bands is to provide a relative definition of high and low prices of a security. By definition, prices are high at the upper band and low at the lower band. This definition can aid in rigorous pattern recognition and is useful for comparing price action to the action of indicators to arrive at systematic trading decisions.
Bollinger Bands can be used on all time frames, including minute, hourly, daily, weekly, and monthly charts. They can be used on any security with high, low, and closing prices, including stocks, futures, and currency pairs.
There are several ways to use Bollinger Bands in trading. One common strategy is to buy when the price touches the lower Bollinger Band and sell when it touches the upper Bollinger Band. This is known as the “Bollinger Band squeeze,” which is a trend reversal trade.
Another strategy is to buy when the price breaks above the upper Bollinger Band and sell when it falls below the lower Bollinger Band. This is known as a “Bollinger Band breakout.”
Bollinger Bands can also be used to identify overbought and oversold conditions. When the price is consistently touching the upper Bollinger Band, it may be overbought, and when it is consistently touching the lower Bollinger Band, it may be oversold.
It is important to note that Bollinger Bands should not be used in isolation, but rather in conjunction with other technical analysis tools and indicators. They are most effective when used in a trend-following approach, as they can help traders identify trend strength and potential trend reversals.
In summary, Bollinger Bands are a technical analysis tool that can be used in a variety of ways in trading. They can help traders identify trend strength and potential trend reversals, as well as overbought and oversold conditions. It is important to use them in conjunction with other technical analysis tools and indicators for the most effective results.


Comments
Post a Comment