Maximize Your Trading Potential with the Parabolic SAR Indicator
The Parabolic SAR (Stop and Reverse) is a technical analysis tool that was developed by J. Welles Wilder Jr. It is designed to identify potential reversals in price trends and can be used by traders to enter or exit trades. In this article, we will explore how the Parabolic SAR can be used to make more informed trading decisions.
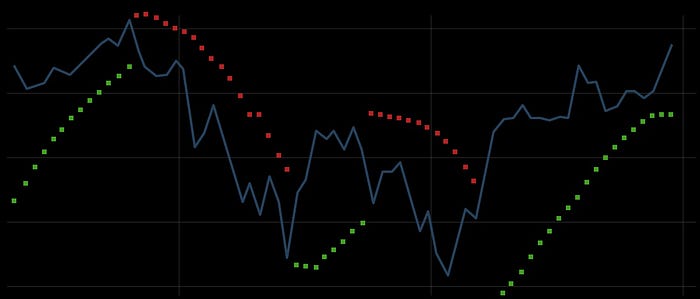
The Parabolic SAR is plotted on a chart as a series of dots, which are placed either above or below the price bars. The position of the dots indicates the direction of the trend, with dots above the price bars indicating a downtrend and dots below the price bars indicating an uptrend.
The Parabolic SAR is based on the idea that as the price of an asset increases, the acceleration of the price increases as well. This acceleration is represented by the SAR dots, which move closer to the price bars as the trend continues. When the dots are close to the price bars, it indicates that the trend is strong and may continue. When the dots are further away from the price bars, it indicates that the trend may be slowing down and a reversal may be imminent.
Traders can use the Parabolic SAR to enter trades by looking for a reversal in the trend. For example, if the dots are below the price bars and the price starts to break above the dots, it could be a signal to buy. Conversely, if the dots are above the price bars and the price starts to break below the dots, it could be a signal to sell.
In addition to using the Parabolic SAR to enter trades, traders can also use it to set stop-loss orders. By using the SAR dots as a trailing stop, traders can protect their profits as the trend continues. For example, if a trader buys an asset and the trend starts to move in their favor, they can use the SAR dots as a trailing stop to lock in profits as the trend continues. If the trend starts to reverse and the price breaks below the SAR dots, the stop-loss order will be triggered and the trade will be closed, protecting the trader’s profits.
It is important to note that the Parabolic SAR is not a standalone tool and should be used in conjunction with other analysis techniques. It is also important to remember that all technical indicators have their limitations and should not be relied upon exclusively. As with any trading strategy, it is important to test the Parabolic SAR on historical data before using it in live trading.
In conclusion, the Parabolic SAR is a useful tool for traders looking to identify potential reversals in price trends. By using the SAR dots as a trailing stop, traders can protect their profits as the trend continues. It is important to use the Parabolic SAR in conjunction with other analysis techniques and to test it on historical data before using it in live trading.


Comments
Post a Comment